Gross Domestic Product
Indonesia’s economic growth is increasing massively amidst the weak global economy and financial market turmoil putting heavy pressure. In Q1 2024, the economy grew 5,11% (year on year). The main contributor to its growth was strong demand aggregate and budget support as a shock absorber decreasing unemployment rate (Cabinet Secretariat of Republic Indonesia 2024). During the first quarter of 2024, the provincial group in Java Island still showed its spatial influence in the Indonesian economy by recording a role of 57.70 percent despite experiencing a slowdown in growth of 4.84 percent compared to the first quarter of 2023 (year on year) (BPS 2024).
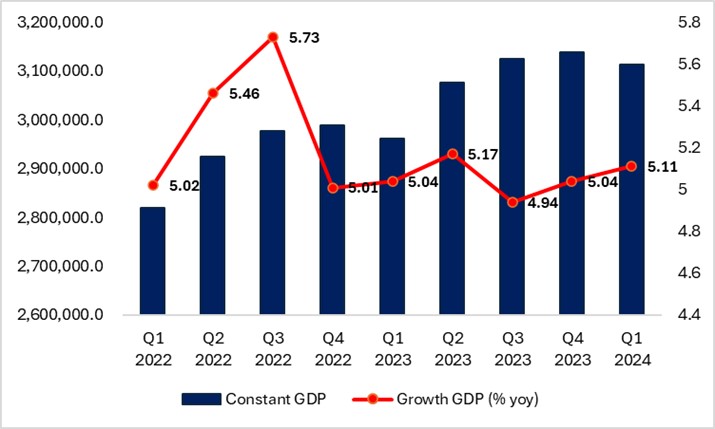 Figure 1. Gross Domestic Product of Indonesia (constant price 2010)
Source: Central Bureau of Statistic Indonesia (2024)
Analyzing economic growth from the production side, in Q1 2024, all industries showed positive performance, except Agriculture, Forestry, and Fishing, which continued to decrease by 3,54%. Delayed planting season caused by El Nino, contributed to the decline of this sector (Bank Indonesia 2024). Furthermore, the sector which led the GDP’s growth was Public Administration and Defence; Compulsory Social Security, 18,88% (year on year). The strengthening pattern was driven by increasing cost of salaries and bonuses for state civil apparatus (Khoerunnisa 2024).
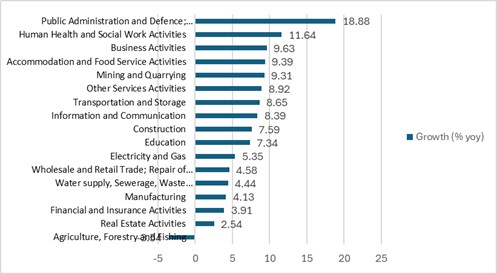
Figure 2. GDP growth by Industry, Q1 2024 (%)
Source: Central Bureau of Statistic Indonesia (2024)
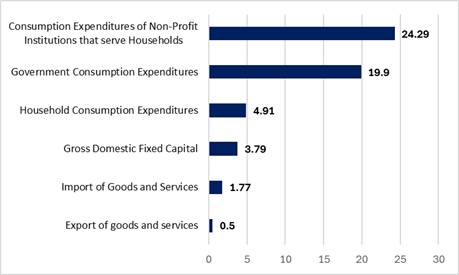
Figure 3. GDP growth by Expenditure, Q1 2024 (% YoY)
Source: Central Bureau of Statistic Indonesia (2024)
Consumption Expenditures of Non-Profit Institutions that serve the Household were the fastest growing component supporting GDP in Q1 2024, 24,29% (year on year). Then, the government consumption still grew significantly, 19,9% (year on year). It was encouraged by increasing cost of salaries and bonuses for state civil apparatus, Eid allowances, and activities related to General Election 2024 (Cabinet Secretariat of Republic Indonesia 2024). The government also spent for good and social spending for maintaining domestic aggregate demand. On another hand, increasing household consumption was also pushed by various products and services related to iftar and Eid al-Fitr. Moreover, acceleration of infrastructure projects in the National Strategic Program and “Ibu Kota Baru” contributed to rise in fixed capital (Rachman 2023). National Research and Innovation is optimistic about increasing Indonesia’s economy in 2024. They estimate that The Fed will not increase their interest rate as high as the last year and the export to China is still above 50 until now (Rachman 2023).
Inflation
Overall, inflation in Q1 2014 was maintained within the 2,5%1% target corridor. Specifically, inflation in Q1 2024 steadily crept. In January 2024, the inflation was maintained within the Central Bank of Indonesia’s target, 0,04% (month to month) or 2,57% (year on year). It was lower than the inflation rate in December 2024. Core inflation was down, primarily influenced by gold jewelry, house rentals, and leasing. Decreasing the inflation rate caused an increase in commodity supply, especially chillies because of production improvement. Then, the administered price showed deflation in this period. The main contributors to its deflation was decreasing airfares after the recent Chrismast and New Year period, as well as adjustments to non-subsidized fuel price.
Then, the inflation continued to rise in February 2024. It was 0,37% (month to month) or 2,75% (year on year) with Consumer Price Index (CPI) of 105,58. The main contributors to the inflation was increasing commodities, such as cooking oil, rice with side dishes, gold jewelry, red chilis, and purebred chicken eggs. Then, the cigarette excise tax also increased. It encouraged the producers to sell machine-rolled clove cigarettes higher. Moreover, it was also primarily increasing inflation.
Unfortunately, in March 2024, the inflation rate was higher than last month, but still within the corridor target . The inflation rate was 0,53% (month to month) or 3,05% (year on year) with Consumer Price Index (CPI) of 106,13. The core inflation and volatile food increased because of seasonal factors, Eid Al-Fitr Celebration and delayed planting season (El Nino). On the other hand, the administered price was lower. The main contributor was decreasing airfares, but disinflation was offset by higher prices of machine-rolled clove cigarettes as producers transmitted higher excise duties on tobacco to consumers.
Moving forward, Bank Indonesia is confident that inflation will remain manageable in the 2.5%±1% target corridor in 2024. Bank Indonesia also controls the inflation by synergy with TPIP and TPID teams through the GNPIP movement in various regions, thus strengthening efforts to maintain stability (Bank Indonesia 2024).
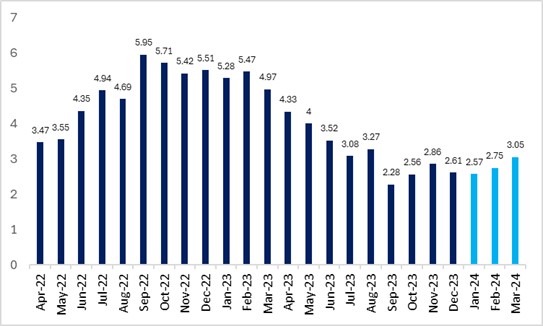
Figure 4. Inflation Rate (%)
Source: Katadata (2024)
Investment
Indonesia saw an impressive investment realization of IDR 401.5 trillion in the first quarter of 2024 (January-March), marking a 22.1% increase compared to the same period last year and equivalent to 24.3% of the total IDR 1,650 trillion president’s investment target for 2024. This surge in investment is dominated by Foreign direct investment (FDI), contributing 50.9% of the total investment with IDR 204.4 trillion, while domestic investment amounted to IDR 197.1 trillion. Both of them—FDI and DDI—showing a strong growth, with the first grew by 15.5% (yoy) and 10.9% (qoq) while the latter showed a 29.7% (yoy) rise or an 8.7% (qoq) increase from the previous quarter. Thus, indicating a strong start without really affected by the wait and see sentiment in election period nor the uncertainty in global demand.
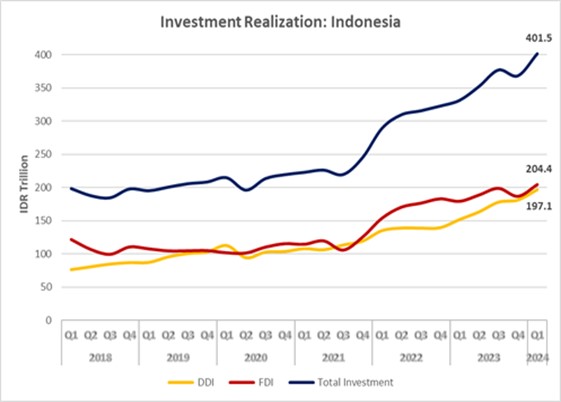
Figure 5. Investment Realization
Source: CEIC (2024)
Looking at the country of origin, Singapore was Indonesia’s largest foreign investor in Q1-2024, contributing US$4.2 billion, followed by Hong Kong and China with US$1.9 billion each, the United States with US$1.1 billion, and Japan with US$1.0 billion. Domestic direct investment (DDI) also saw a significant rise, reaching IDR 197.1 trillion from IDR 151.9 trillion.
More importantly, the distribution of investment realization between Java Island and regions outside Java Island this quarter is nearly balanced, with Java Island contributing IDR 200.5 trillion (49.9%) and areas outside Java Island contributing IDR 201.0 trillion (50.1%). Investment realization in both Java and outside Java experienced increases of 28.5% and 16.3%, respectively, compared to the same period in 2023 (BKPM, 2024). Furthermore, West Java attracted the most foreign and domestic investment, securing IDR 64.7 trillion. While among the top five provinces, there is province outside Java, Central Sulawesi, in fourth position with a contribution of IDR 27 trillion.
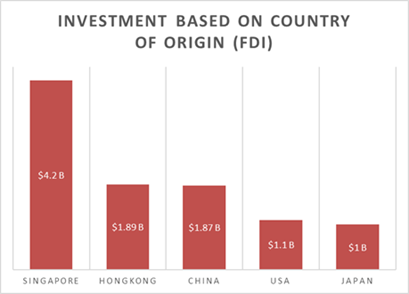
Figure 6. FDI Based on Country of Origin Source: BKPM (2024) |
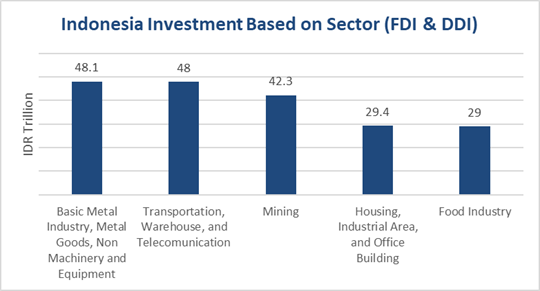
Figure 7. Investment Based on Sector Source: BKPM (2024) |
In terms of sectors, Domestic investors primarily directed their funds towards the infrastructure and service sectors, totaling IDR 104.5 trillion, while foreign investors focused mainly on the manufacturing sector, with investments amounting to IDR 112.5 trillion. Manufacturing led the investment with IDR 48.1 trillion, particularly in basic metals and related products. Nickel smelter construction dominated downstream program investments in Q1-2024, amounting to IDR 33.4 trillion, followed by copper smelters with IDR 8.4 trillion and bauxite smelters with approximately IDR 1.4 trillion. Thus making up Investments in metal refining facilities or smelters reached IDR 43.2 trillion.
The transportation, warehousing, and telecommunications sector came second with IDR 48.0 trillion, followed by mining with IDR 42.3 trillion, housing, industrial, and office areas with IDR 29.4 trillion, and the food industry with IDR 29.0 trillion. Overall, over 40% of investments in this quarter went to the manufacturing sector, with the downstream program investments contributed 18.9% to the total investment in Q1-2024, amounting to IDR 75.8 trillion. Despite of that, the infrastructure and service sectors received the highest share of investment in Q1-2024, accounting for 42.1% of the total investment at IDR 169.2 trillion. This was followed by the manufacturing sector with IDR 161.1 trillion and the primary sector, including natural resource development, with IDR 71 trillion.
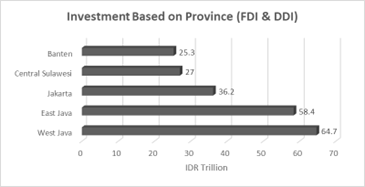
Figure 8. Investment Based on Province
Source: BKPM (2024)
The Indonesian government, through the Ministry of Investment/Investment Coordinating Board (BKPM), is dedicated to achieving the 2024 investment target of IDR 1,650 trillion set by the president. To meet this goal, the Investment Acceleration Task Force will work to facilitate and address challenges faced by large-scale strategic investment plans. The government aims to meet the president’s target and boost the economy to grow above 5%.
Balance Trade
In the first quarter of 2024, Indonesia recorded a trade surplus of USD 7.34 billion. However, this positive figure is part of a broader downward trend that has been ongoing since the third quarter of 2022. The trade surplus for Q1-2024 was USD 7.31 billion, a 39.40% decrease compared to the same period last year. This decline is primarily due to a significant drop in exports, which fell by 7.20% year-over-year to USD 62.20 billion. In contrast, imports experienced a slight contraction of 0.10% year-over-year, amounting to USD 54.90 billion. This disparity in export and import growth rates has led to a reduced trade surplus. Several factors contribute to this trend, including the moderation of commodity prices, which impacts Indonesia’s export revenues due to its dependency on commodities. Additionally, China’s economic slowdown has reduced demand for Indonesian exports, as China is a major trading partner. Exports to China, which make up over 20% of Indonesia’s total exports, dropped by 16.24% year-over-year to USD 13.36 billion in Q1-2024.
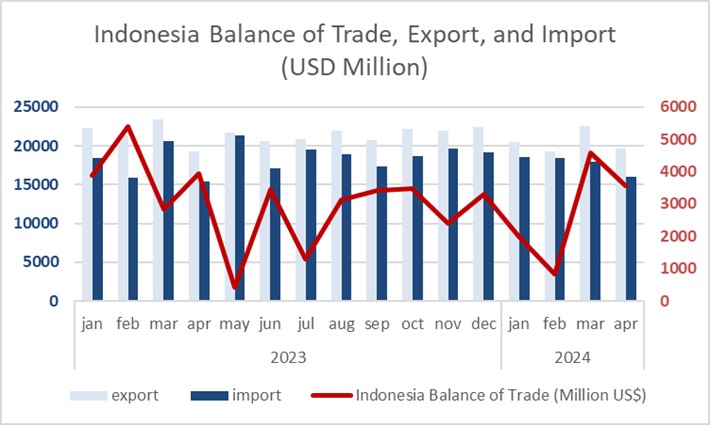
Figure 9. Balance of Trade, Export, and Import
Source: Central Bureau of Statistic Indonesia (2024)
The declining global demand from major trading partners is expected to further decrease Indonesia’s trade surplus. This trend is driven mainly by economic slowdowns in these regions, which diminish the demand for Indonesian exports. However, recent increases in commodity prices, such as those for crude oil and rubber, might help stabilize the trade surplus by mitigating some effects of the reduced global demand. Indonesia’s exports are largely comprised of raw materials and commodities. From January to February 2024, around 47% of Indonesia’s total exports consisted of mineral resources, vegetable and animal fats, and pearls, diamonds, and precious metals. This heavy reliance on commodity exports means that any fluctuation in global commodity prices directly impacts Indonesia’s trade balance. Meanwhile, approximately 90% of Indonesia’s total imports are raw materials and capital goods, supporting manufacturing and production. An increase in the latest Manufacturing Purchasing Managers’ Index (PMI) indicates a rise in manufacturing activity, which suggests a higher demand for raw materials and capital goods, likely leading to an increase in imports.
The reduction in the trade surplus in Q1-2024 broke the rising trend of the quarterly trade balance seen since Q3-2023. Previously, the goods trade balance increased by USD 1.36 billion from Q3-2023 to Q4-2023, driven by a larger increase in exports compared to imports during that period. Despite the growing surplus in goods trade, the current account deficit widened. In the last quarter of 2023, the current account deficit was USD 1.29 billion (0.4% of GDP), an increase of USD 0.25 billion from the previous quarter’s deficit of USD 1.04 billion (0.1% of GDP). The decreasing current account balance was due to a rising deficit in the service trade balance, increased foreign tourist arrivals during the end-of-year holiday season, higher freight costs from increased goods imports, and a widening primary income deficit due to interest payments to foreign creditors. The current account balance is expected to remain negative in Q1-2024 due to the narrowing trade surplus in goods.
The changing sentiment towards delaying rate cuts by the Fed has led to capital outflows from emerging economies, including Indonesia. Consequently, Indonesia saw a cumulative outflow of USD 1.89 billion from the bond market in the first three months of 2024. However, there was an inflow of around USD 1.56 billion into the domestic equity market during the same period. With investors maintaining a positive outlook on Indonesia’s growth and reduced uncertainty following the projected Presidential election quick-count results, capital inflows into the equity market have lessened the overall net capital outflow. Cumulatively, Indonesia experienced a net capital outflow of USD 0.3 billion in Q1-2024.
The narrowing trade surplus, along with net outflows from the domestic financial market during January-March 2024, has significantly depreciated the Rupiah. By the end of March 2024, the Rupiah had depreciated by 2.96% year-to-date, performing worse than its peers, such as the Indian Rupee, Philippine Peso, and Chinese Yuan. This substantial pressure on the Rupiah has depleted foreign asset reserves, which have been used to stabilize the currency. By March 2024, foreign asset reserves stood at USD 140.4 billion, a decrease of almost USD 6 billion since December 2023.
Sectoral Outlook
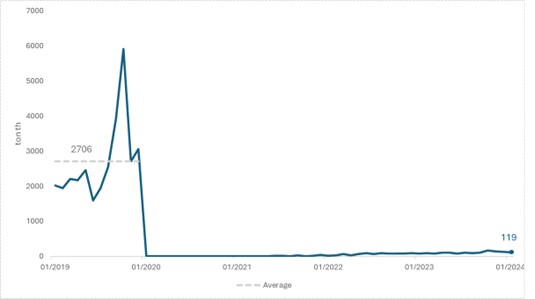
Figure 10. Indonesia’s Nickel Ores and Concentrates Exports Volume
Source: CEIC (2024)
On January 1st 2020, the nickel ore export ban signaled the start of nickel downstreaming in Indonesia. Four years later, this policy remains in effect. As of January 1st 2024, the export volume of nickel ore was recorded at just 119,000 tons. This amount is much lower than the average levels in 2019, which recorded 2,706,000 tons, as illustrated in Graph 3.1.
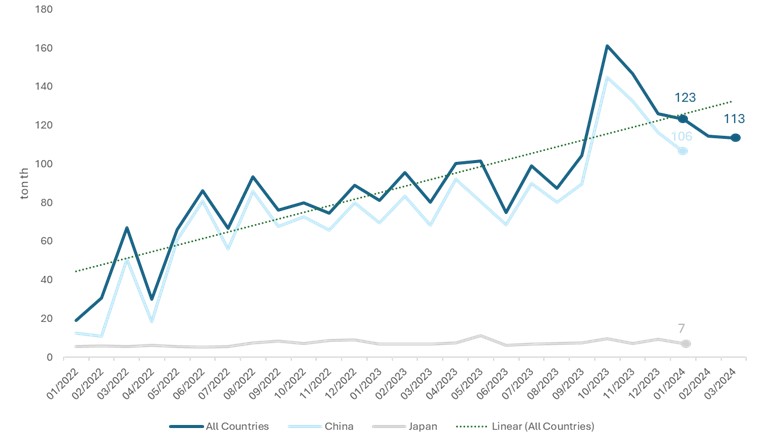
Figure 11. Indonesia’s Nickel and Articles Thereof Exports Volume
Source: CEIC (2024)
The most basic product of nickel ore is nickel articles and thereof. Due to nickel downstreaming, the trend for this product has been positive since the government ambitiously promoted the processing of raw materials. In March 2024, the export volume of nickel and its derivatives was recorded at 113,000 tons, which is higher than last year’s production of approximately 70,000 tons. However, the volume has been decreasing over the last three months. The most important to note is that most of these processed nickel products that were exported are shipped to China. In January 2024, more than 85 percent of the exports were destined for China. In comparison, Japan, the second largest destination, received only around 5 percent.
In terms of total export value, the policy has significantly multiplied the monthly exports of nickel and articles thereof to $459 million in March 2024, up from $81 million a month before the policy was implemented (CEIC, 2024).
Central Government Operation
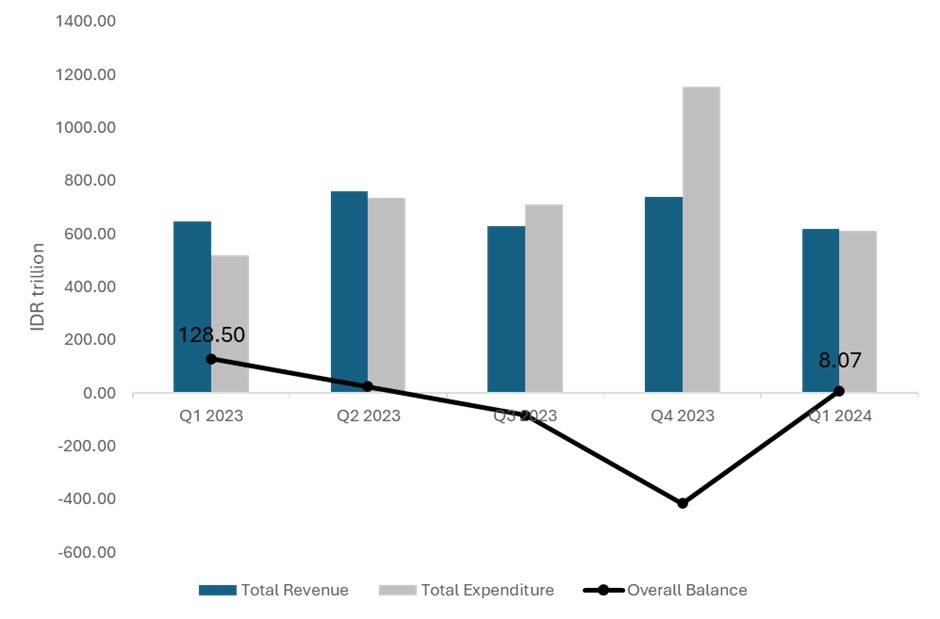
Figure 12. Indonesia’s Central Government Operation
Source: CEIC (2024)
In Q1 2024, Indonesia’s fiscal performance showed signs of contraction with an overall balance of IDR 80.74 trillion, compared to Q1 2023’s balance of IDR 128.49 trillion. This downturn reflects a slight decrease in total revenue, which fell from IDR 647.15 trillion in Q1 2023 to IDR 620.01 trillion in Q1 2024. Simultaneously, total expenditure rose from IDR 518.66 trillion in Q1 2023 to IDR 611.94 trillion in Q1 2024. The significant rise in expenditures coupled with the dip in revenue has contributed to the tightened fiscal space compared to the previous year.
Tax Realization
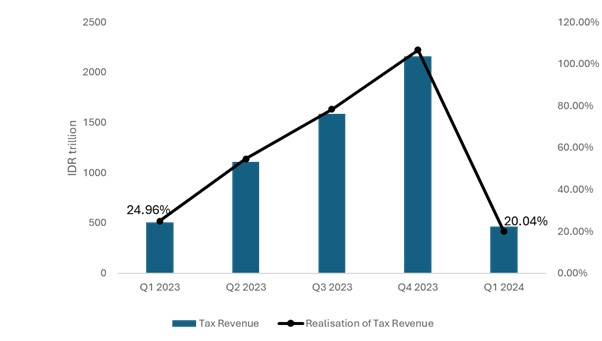
Figure 13. Indonesia’s Tax Revenue
Source: CEIC (2024)
Tax revenue performance in Q1 2024 shows a slight decrease in a year-to-date comparison. In Q1 2023, tax revenue was IDR 504.48 trillion, achieving 24.96% of the set target for the period. The revenue significantly decreased to IDR 462.91 trillion in Q1 2024, achieving only 20.04% of the target and indicating a more challenging start to the fiscal year. This downturn in the initial quarter sets a challenging precedent for attaining the higher annual tax revenue target of IDR 2,309.9 trillion for 2024, especially when compared to the 2023 target of IDR 2,021.22 trillion.
Reference
Antara News. 2024. “Economic Growth in 2024 Q1, Q2 Projected Surpassing Q4 of 2023.” Antara News. 24 April 2024. https://en.antaranews.com/news/311685/economic-growth-in-2024-q1-q2-projected-surpassing-q4-of-2023.
Bank Indonesia. 2024a. “Inflasi Februari 2024 Terjaga.” 2024. https://www.bi.go.id/id/publikasi/ruang-media/news-release/Pages/sp_264224.aspx#.
———. 2024b. “Inflasi Januari 2024 Terjaga.” 2024. https://www.bi.go.id/id/publikasi/ruang-media/news-release/Pages/sp_262124.aspx#.
———. 2024c. “Inflasi Maret 2024 Terjaga.” 2024. https://www.bi.go.id/id/publikasi/ruang-media/news-release/Pages/sp_266524.aspx.
Badan Koordinasi Penanaman Modal (BKPM). 2024. “Data Realisasi Investasi” 2024. https://nswi.bkpm.go.id/data_statistik
BPS. 2024a. “[2010 Version] 4. Growth Rate of GDP at Constant Market Prices By Expenditure – Statistical Data.” 2024. https://www.bps.go.id/en/statistics-table/2/MTA4IzI=/-2010-version–4–growth-rate-of-gdp-at-constant-market-prices-by-expenditure–percent-.html.
———. 2024b. “Growth Rate of GDP by Industry (2010=100) – Statistical Data.” 2024. https://www.bps.go.id/en/statistics-table/2/MTA0IzI=/growth-rate-of-gdp-by-industry–2010-100—percent-.html.
———. 2024c. “Growth Rate of GDP by Industry (2010=100) – Statistical Data.” 2024. https://www.bps.go.id/en/statistics-table/2/MTA0IzI=/growth-rate-of-gdp-by-industry–2010-100—percent-.html.
———. 2024d. “[Seri 2010] 2. PDB Triwulanan Atas Dasar Harga Konstan menurut Pengeluaran – Tabel Statistik.” 2024. https://www.bps.go.id/id/statistics-table/2/MTk1NiMy/-seri-2010–2–pdb-triwulanan-atas-dasar-harga-konstan-menurut-pengeluaran–milyar-rupiah-.html.
———. 2024e. “Balance of Trade (Million US$)” 2024. https://www.bps.go.id/en/statistics-table/2/NDk4IzI=/balance-of-trade–million-us–.html
———. 2024f. “The Value of Exports (Million US$)” 2024. https://www.bps.go.id/en/statistics-table/2/MTk2IzI=/the-value-of-exports–million-us–.html
———. 2024g. “Value of Imports (Million US$)” 2024. https://www.bps.go.id/en/statistics-table/2/MTk2IzI=/the-value-of-exports–million-us–.html
Cabinet Secretariat of Republic Indonesia. 2024. “Sekretariat Kabinet Republik Indonesia | Indonesia Posts 5.11% Economic Growth in Q1 of 2024.” Cabinet Secretariat of Republic Indonesia, 2024. https://setkab.go.id/en/indonesia-posts-5-11-economic-growth-in-q1-of-2024/.
Katadata. 2024. “Inflasi Indonesia Sentuh 3,05% pada Maret 2024 | Databoks.” 2024. https://databoks.katadata.co.id/datapublish/2024/04/01/inflasi-indonesia-sentuh-305-pada-maret-2024.
Khaerunnisa, Rizky. 2024. “Menakar mesin pertumbuhan ekonomi RI setelah kuartal I.” Antara News. 18 Mei 2024. https://www.antaranews.com/berita/4110309/menakar-mesin-pertumbuhan-ekonomi-ri-setelah-kuartal-i.
Rachman, Arrijal. 2023. “Begini Prospek Ekonomi RI Melaju di Tengah Suramnya Global.” CNBC Indonesia. 2023. https://www.cnbcindonesia.com/news/20231220170518-4-498994/begini-prospek-ekonomi-ri-melaju-di-tengah-suramnya-global.